Reports and Charts
Report Principles
Reports in Sym3 Designer are based on Counters. A counter stores the values and time stamps for any equipment or system property during the simulation. By default, the counter just stores the Last Value of the property. Additional calculation operations may be chosen to alter the counter values. For example the Average Value or Peak value of the property can be used instead of the last value.
The counters can be plotted on a chart and/or stored in log files for further processing and analysis.
Create a new report
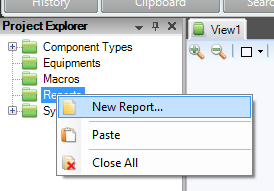
Creation and edition of reports is done using the 'Project Explorer'.
Right-click on the 'Reports' folder and select ‘New Report…’.
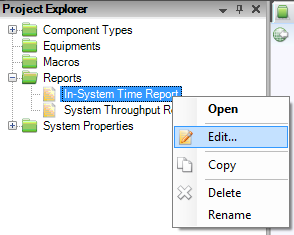
Edit an existing report
Right-click on the report and select ‘Edit’ in the contextual menu.
The report Properties dialog is opened:
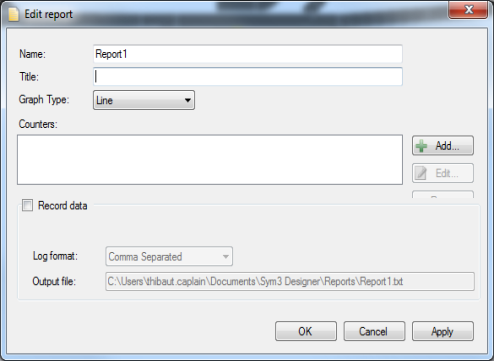
- Name: name of the report you want to create. This is the name you will see in the project explorer
- Title (Optional): you can enter a title to have a better description of the report. This title will be displayed in the window that will display the report.
- Graph Type: see chart types
- Counters: You can Add/Edit/Remove counters by using buttons on the right side of the counter list. Double-click on a counter will edit it. Using a ‘line graph type’ for example: one line will be drawn per counter. A counter is what you want to report.
- Record Data: if this option is checked, report data will be saved on a file on disk when the simulation will be ‘running’:
- Log Format: you can choose the file format that will be used (Comma separated, Tab separated or SQL)
- Output File (CSV/TSV display only): shows you where you file will be saved. The output folder can be specified in the option dialog. Please refer to the ‘Option’ chapter)
- Data source (SQL only): enter a data source string.
New in V7.1, changes to the report definition can be made using the Edit button. With the simulation is running, the user is not able to change the report name, the graph type or edit a counter. To make these changes the simulation must be stopped.
Chart types
Currently the application allows you to create line graph and column graph.
- Stepped Line: If the current value doesn't change, the chart will draw a horizontal line between the last point and the current time point.
- Column: Sym3 Designer will draw a column
Add/Edit a counter
- In the Project Explorer right-click on the report > Edit
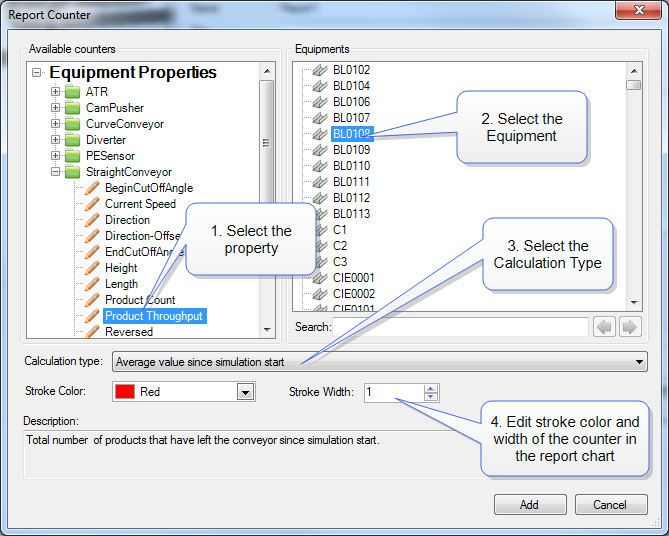
- Click Add or Edit to display the Report Counter selection dialog:
- Select a property
- Select the equipment (if necessary)
- Select the calculation type
- Select the stroke color and size for the counter in the report chart
- Click Add or OK.
Calculation types
- Last Value: the counter stores the current value and time stamp each time the value change
- Average Value since Simulation Start: each time the value changes, the counter stores the Time weighted average of the property since simulation start
- Average Value in last minute: each time the value changes, the counter stores the time weighted average of the property between now and 1 minute ago
- Count of value changes during last minute: each time the value changes, the counter stores the number of times the value has changed during the last minute. Default value when simulation start is NOT included (start at 0).
- Count of value changes since simulation start: each time the value changes, the counter stores the number of times the value has changed since simulation start. Default value when simulation start is NOT included (start at 0).
- Peak Value during last minute: each time the value changes, the counter evaluates the max value of the property during the last minute and stores it if it has changed: the counter value changes to the current value if the current value is more than the counter value.
- Peak Value since Simulation start: each time the value changes, the counter evaluates the max value of the property since simulation start and stores it if it has changed: the counter value changes to the current value if the current value is more than the counter value.
- Sum of all values since Simulation start: each time the value changes, the counter stores the sum of all the values since simulation start: start value is the default property value, then each time the value is changed, the counter adds this value to the counter.
View a report
You have two solutions to view a report by using the project explorer:
- Right-click on the report and select “Open”
- Double mouse click (left button) on the report
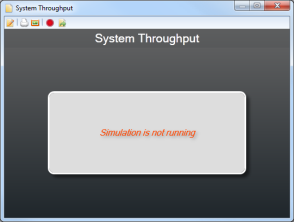
If the simulation is not running, nothing is displayed:
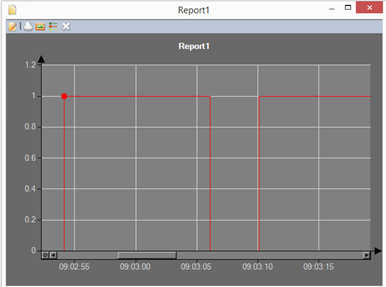
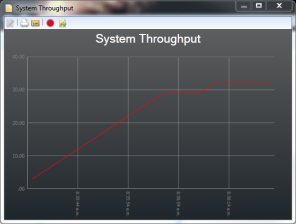
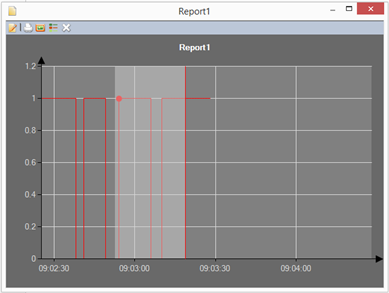
If the simulation is running, the selected chart is plotted:
Some actions are possible in the small toolbar on top of the report dialog:
- Edit report...: Allow the user to make changes to the report parameters
- Print: Print the current report graph
- Screenshot: Take a screenshot of the current report graph. The screenshot will be an image. You can obtain this image in the clipboard (Paste (Ctrl+V) in a Word document for example) or save it on disk (BMP, PNG or JPG format).
- Show Hide Legend: Show or hide the report legend key associated with each line.
- Clear: Clear the data without having to stop and restart the simulation.
Counter Logs
Sym3 Designer can store counters in CSV of TAB delimited files. Sym3 will write a line with all counter values included in the report each time one of the counter value changes. If several counter value changes at the exact same time, Sym3 will write one line for each counter value change. Each new line will include the current value of each counter.
Example: 4 counters, changing values at the following time stamps:
- All counters are 0 at 00:00:00
- counter1 = 1 at 00:00:01
- counter2 and 3 = 3 at 00:00:10
- counter 4 = 4 at 00:14:00
The resulting log will be:
| Timestamp | Counter1 | Counter2 | Counter3 | Counter4 |
| 00:00:00 | 0 | 0 | 0 | 0 |
| 00:00:01 | 1 | 0 | 0 | 0 |
| 00:00:10 | 1 | 3 | 0 | 0 |
| 00:00:10 | 1 | 3 | 3 | 0 |
| 00:14:00 | 1 | 3 | 3 | 4 |
To store the counter values with time stamps in counter logs
Right-click on the counter, select Edit
Tick Record Data and select the file format.
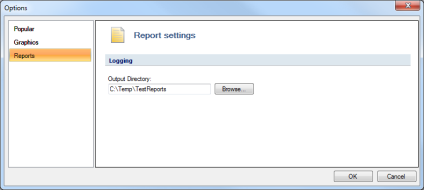
Change location of the counter logs
Click on the application button > Options.
Select Reports
Edit the Output Directory field
Scale a report window
New in Ver7.1, the user can Zoom In/Zoom out the report window.
A tooltip shows the value that is currently displayed on the chart so that detailed information for a particular period of time during the simulation can be examined.
A user can ‘zoom-in’ by mouse left click and drag/release. The report will then zoom in and display a scroll bar as below: